Thursday, December 18, 2014

Place Your Bets


The Federal Reserve maintains a steady hand, signaling "normalization" (higher interest rates) to come in the middle of 2015.  The dollar rallies. Stocks rally.  Bonds sell off.  I buy the USD/JPY and sell the EUR/USD.  The correction in the stock market seems to be over.  Santa Claus is here.

Sunday, December 14, 2014

El-Erian's Oracular Buzzings


Mohamed El-Erian expects the dollar to be strong next year.  He also describes a multi-track global economy.

Dollar rally to continue.


Multitrack Central Banking


Tuesday, October 21, 2014

Stopped Out


After a wild ride in the cattle market for two days, I exited my position at no loss.  The fundamentals haven't changed, but timing is important.  I may try again, if I see an opportunity I like.

Monday, October 20, 2014

Less Cattle This Year


Last year's drought and high feed prices resulted in some leaving the cattle business.  This year there is less beef production and prices are up.  The shortage should continue through the first quarter of next year, and the markets continue to adjust.  Meanwhile, global demand for beef is still strong.  I have taken a long position in February Live Cattle Futures.  Maybe the price of beef will go up a nickel a pound.

Thursday, October 09, 2014

Economic Forces at Work--Markets Adjusting


I have moved 100% to the sidelines as the markets adjust to lower global expectations of growth.  10-year US Treasuries were steady today. Equities and energy prices not so much.  

Wednesday, October 08, 2014

Comparing the S&P500 to the 10-year US Treasury yield


As the S&P Index has risen this year, the yield on the 10-year Treasury Note has fallen.  On a closer look, it seems that there is a "risk on, risk off"  interconnection between the two on a daily basis going on at the moment.  Let us say that when the S&P500 falls, money moves out of stocks and into bonds, thus "risk off."  Bond prices go up and the yield goes down.  When the stock market rallies, money moves out of bonds and into equities, "risk on."  Bond prices go down (less demand) and yield goes up.

Theoretically, as the Fed buys less bonds, there should be less demand, and yields would go up.  But the market may have already priced the Fed's action into the market.  So today's release of the Fed's minutes, absent some surprise, should not move the market much.  Risk on.  Those are my thoughts before the Fed releases its September meeting minutes.

Monday, September 22, 2014

I Close My Wheat Trade


I closed my December Wheat trade at 478 today.  I continue to monitor the state of the markets and make adjustments in accord with economic developments.

Saturday, September 13, 2014

Bumper Crop


On September 5, 2014, I sold my position in Priceline because I didn't like the way the chart was looking.

Yesterday, September 11, 2014, the USDA released its monthly report on World Agricultural Supply and Demand Estimates.  The report was bearish for the grain markets.  As a result I decided to take a short position in December Wheat Futures, even though it is late in the move. I think wheat may go lower to $4.50.

WASDE Report Here

Thursday, September 04, 2014

Draghi Moves Markets with Rate Cut, etc. Euro falls below $1.30


Your dollar buys 1.5% more German automobiles today than it did yesterday.

Read More Here

Wednesday, August 13, 2014

Excess Bank Reserves


There are currently upwards of $2.619 trillion of excess reserves held at the Fed by depository institutions.  This is money that could be lent out by banks but isn't.  Is this an explanation for the extremely low velocity of money?  I'm sure it has something to do with it.  Why aren't the banks lending?

What Does It Mean?


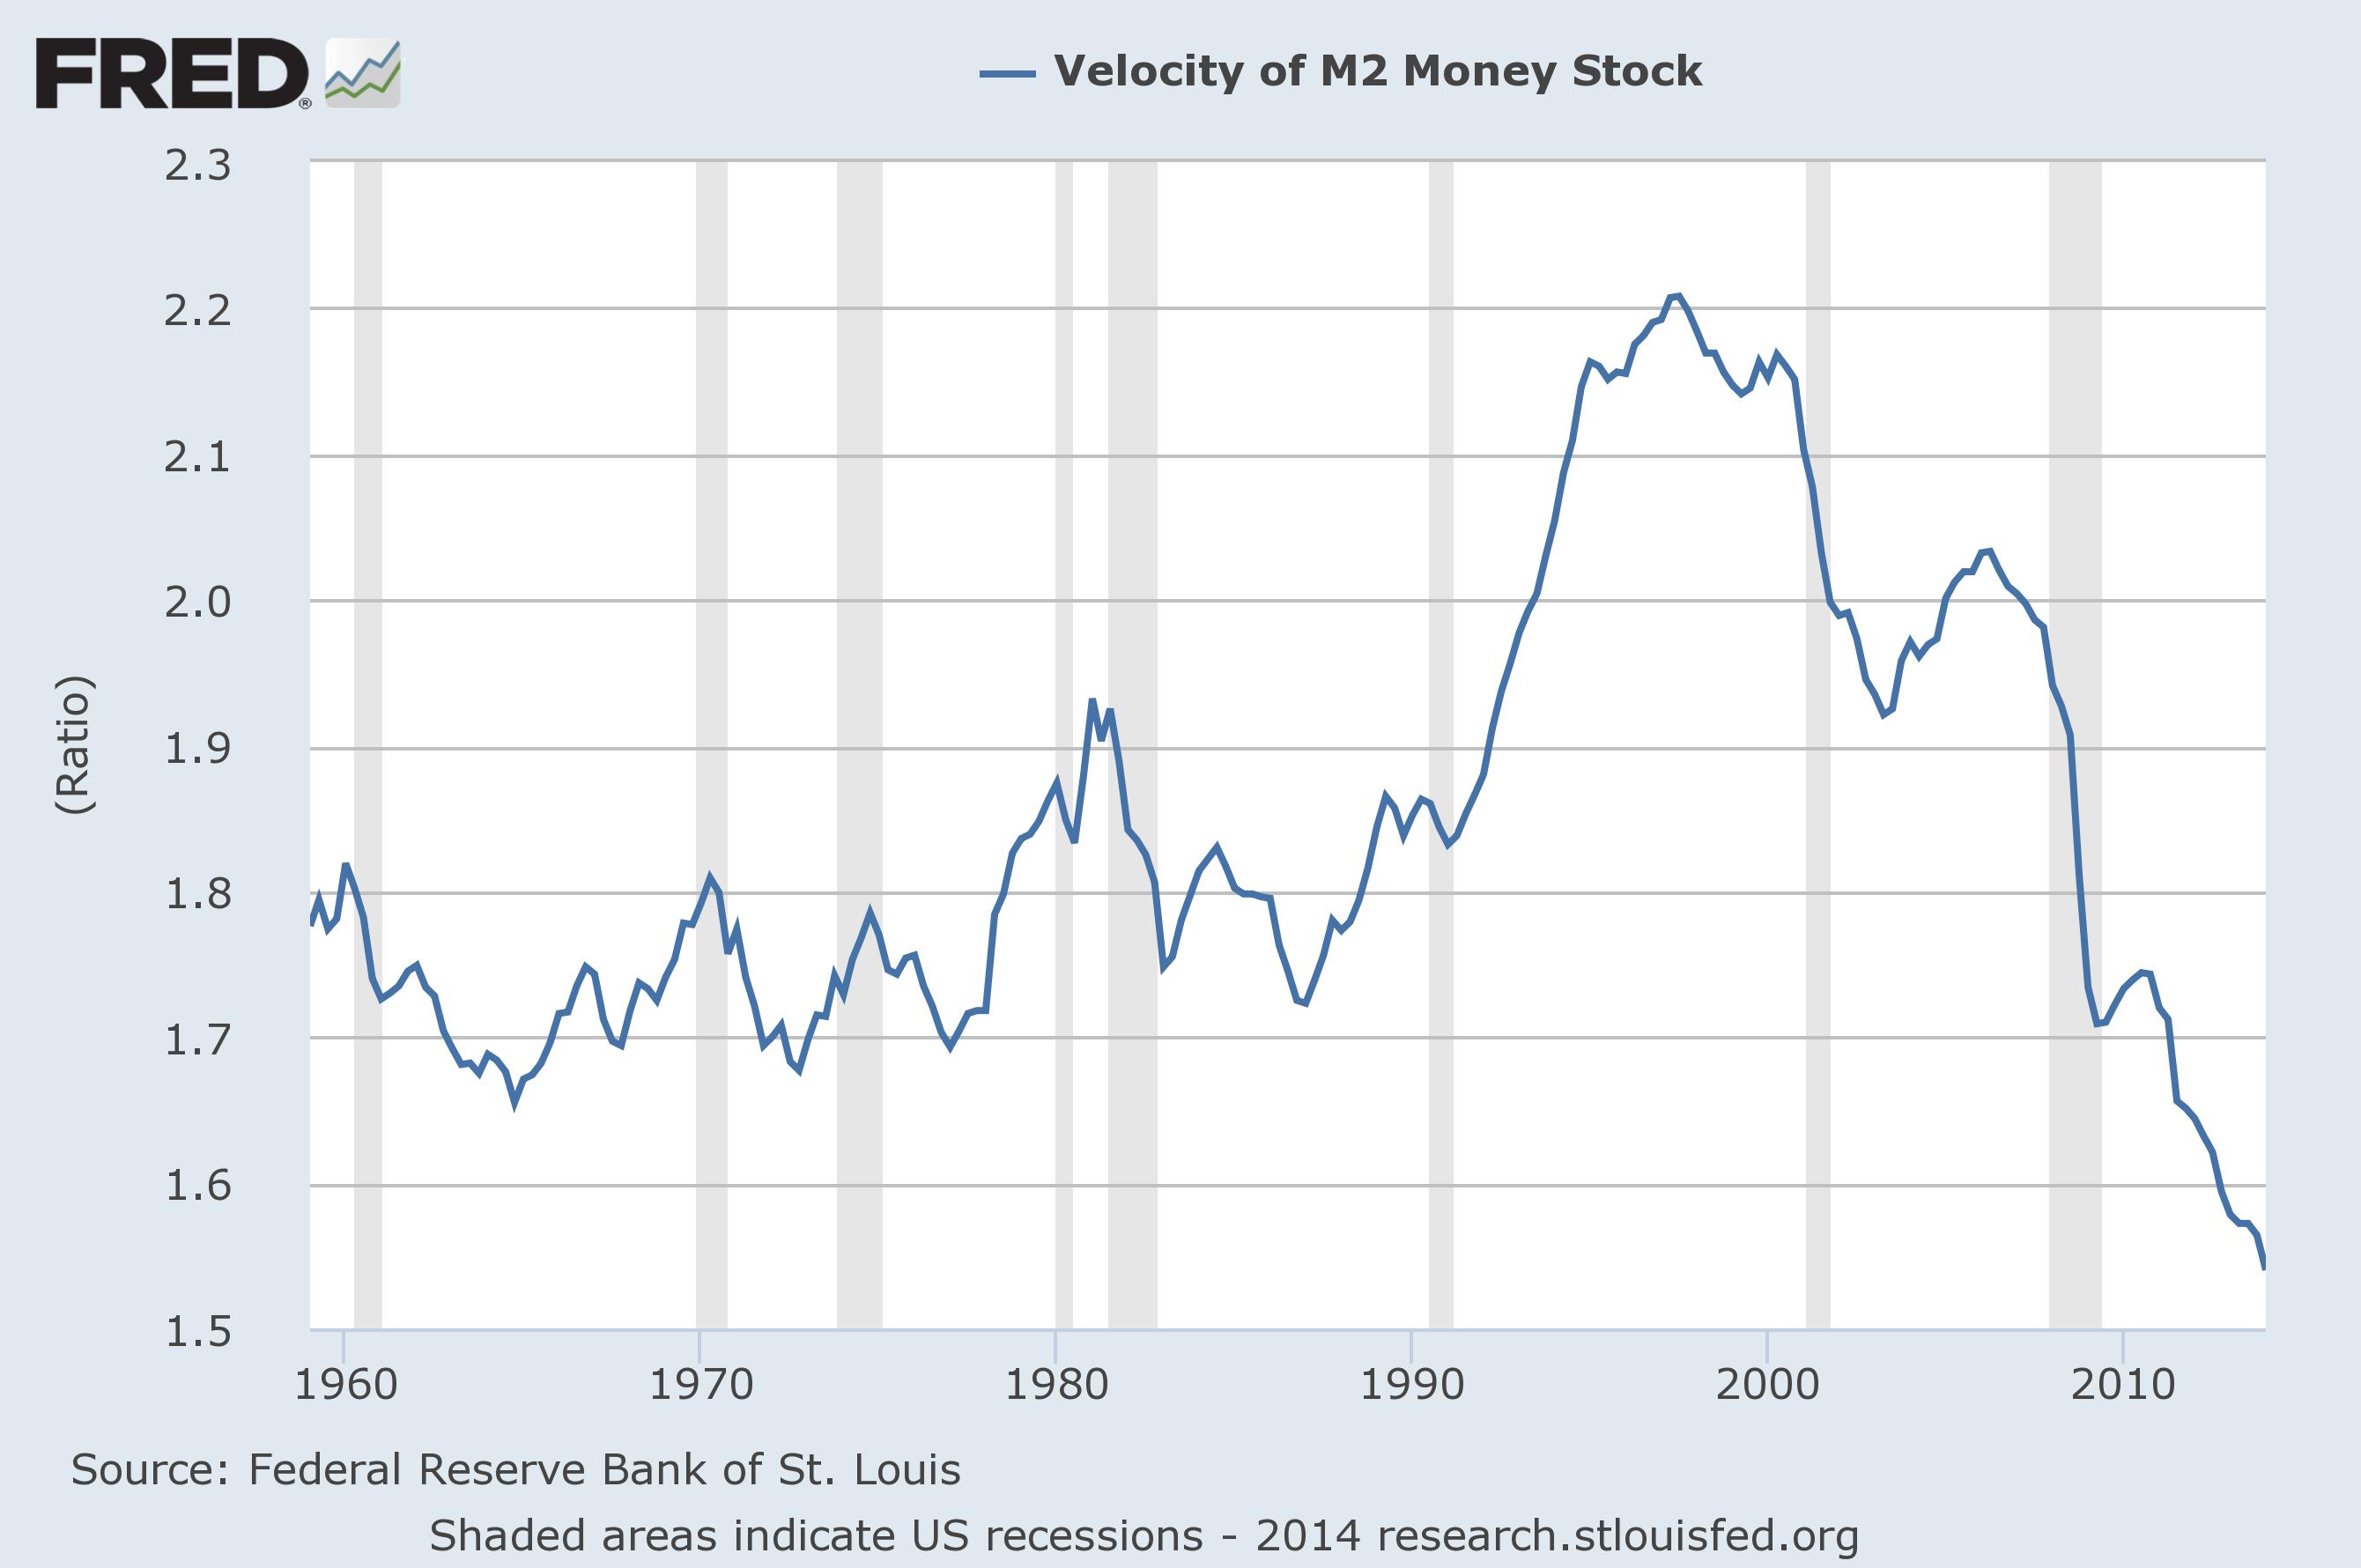
According to this graph from the Federal Reserve Bank of St. Louis, the velocity of the M2 money supply is lower than it has been for over 55 years at 1.531


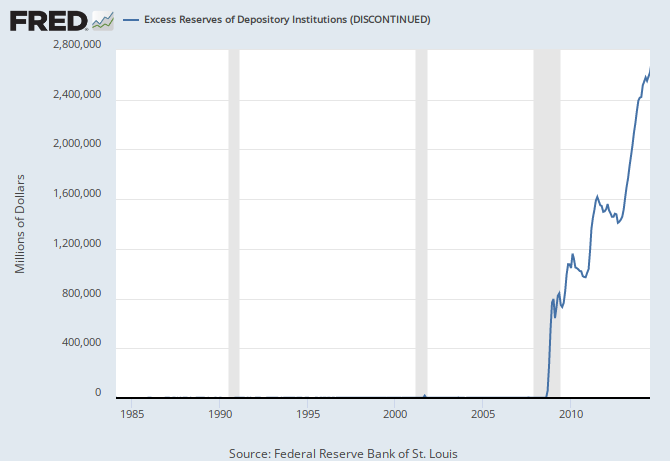
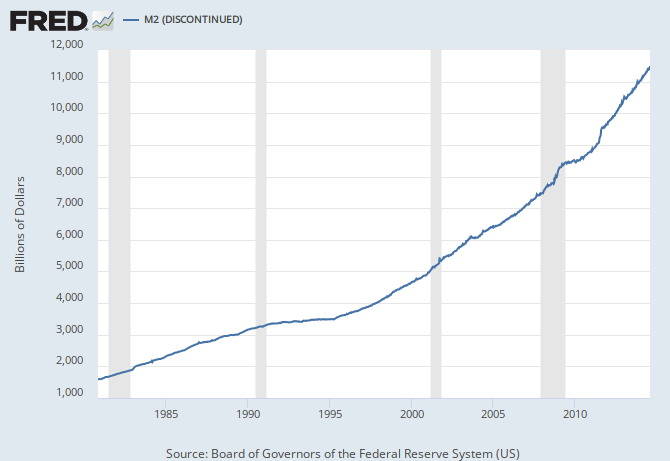
Meanwhile, the M2 money supply continues to grow at a fast pace.  As of June 2014, the M2 was $11.3514 trillion (seasonally adjusted).


According to the Quantity Equation of Money

Money Supply x velocity = GDP deflator x real GDP

or

MV = PV

where V is velocity, P is the GDP deflator, and Y is real GDP.


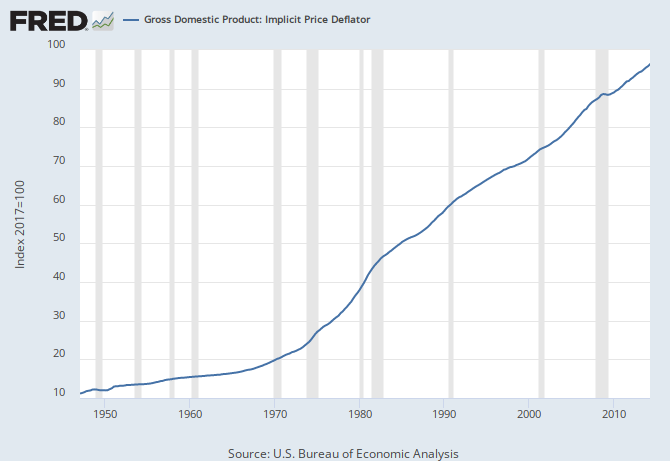
The implicit GDP deflator is 108.188 where Index 2009 = 100.  In other words, the real GDP is in 2009 dollars.


As of the second quarter of 2014, the real GDP is $15.985.7 trillion.

PY would equal 1.08188 x 15.9857 or a nominal GDP of $17.2946 trillion

The MV side of the equation would be about $17.379 trillion, so the equation holds pretty much, allowing for rounding errors.

So why don't we have higher inflation despite the Fed "printing all that money?"  The explanation must have something to do with the record low velocity of money.  My investigation continues.  Meanwhile there is a $17 trillion economy out there.  Be grateful.


Tuesday, July 15, 2014

Yesterday I exited my position in MRO call options

The crude oil market hysteria has died down somewhat, as it becomes more clear that the main Iraq oil production for export is further south than the Islamic State is likely to reach in the near future. Oil supplies are unlikely to be disrupted in the next little while. With only 4 days left until expiration of the July call, I thought it best to exit the position which was 'in the money.'

The Iraq Oil Report is a website with useful information about the situation.
http://www.iraqoilreport.com/

I also like to read Army Times Early Bird Brief


Tuesday, July 01, 2014

Shift in Supply Curve Bearish for November Soybeans

Falling corn prices mean falling returns for farmers.  Some of them decide to plant soybeans instead.  Result, the supply curve for soybeans shifts to the right.  Prices for soybeans also fall.

Graph of Supply and Demand for Soybeans

Markets react to Monday's USDA crop report


Trading futures is like playing with dynamite.  You better know what you are doing.

Sunday, June 15, 2014

Hedging Upside Risk in Oil Prices for the next Thirty Days


I took an "at the money" July call option position in MRO on Friday to protect against the risk of oil prices heading higher over the next thirty days, due to volatility in the middle east, etc.

Thursday, June 12, 2014

How Low Can Grains Go?


Intelligence from the USDA Office of the Chief Economist (World Agriculture Supply and Demand Estimate) June 11, 2014, report (WASDE 560).

WASDE 560 the complete report

Preliminary conclusion:  Could be some money to be made on the short side of grains, somehow.

Wednesday, May 07, 2014

Hypothesis Testing--VIX Shows Bull Market Intact


I am still holding GOOGL, GOOG and PCLN, despite several technical sell signals.

My hypothesis is that with VIX remaining low, the bull market is intact.  This idea is causing me discomfort, because my stocks have been sinking, causing me that well-known feeling that I should sell.  It is somewhere around anxiety or fear for me as I wait for the VIX to prove me right.  As far as I can tell, the correlation between Google and S&P500 is .76.  It seems to be a little less at the moment.  Even so, I ask myself if I would buy Google at this price and I say 'yes.'  But holding it is still uncomfortable.

Friday, March 21, 2014

Hypothesis Null


I made a small bet last week that the Crimean Crisis would move the oil market.  That hypothesis was null.  It seems in the global economy, at least for now, what Janet Yellen says is more important than what Putin does in the Ukraine.

Yesterday, I took profits in Gilead Sciences, Inc. (GILD) on a technical sell signal.  Then I put the freed up cash into Google (GOOG).  That leaves me holding Google and Priceline only.

Monday, February 03, 2014

Toppy


The New York Stock Exchange Bullish Percent indicator flashed "Bear Confirmed" on January 27.  Last June it did the same thing, but the signal was false.  Last time I took the signal and got out of the market.  This time I'm wondering if this may be a 'normal' correction and I should wait it out.


Last June the VIX moved up near 22, which is relatively low in terms of a fear reading.  Today it is reading close to 21, so the number is comparable.  Last June the VIX peaked and then fell back to 12 while the market rallied.  A peak in the VIX is a short-term buy signal.  I am watching carefully to see which it is this time.  That's why they pay me the big bucks.